Research papers | Newest first
Maps and simulations of the nearby Milky Way
This page collects six papers on ionized gas, three-dimensional maps, and the local Galactic magnetic field, with a few figures from each.
2026
H I density and radial velocity
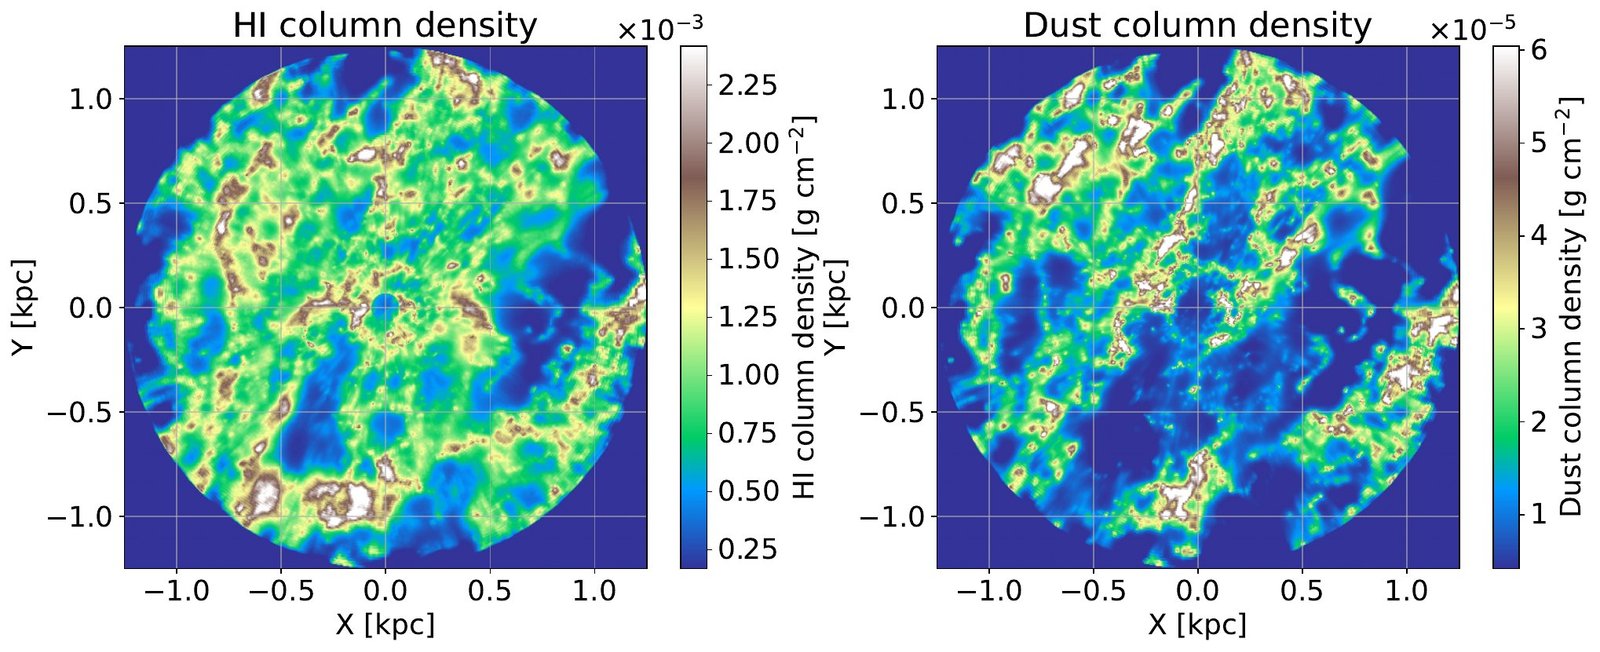
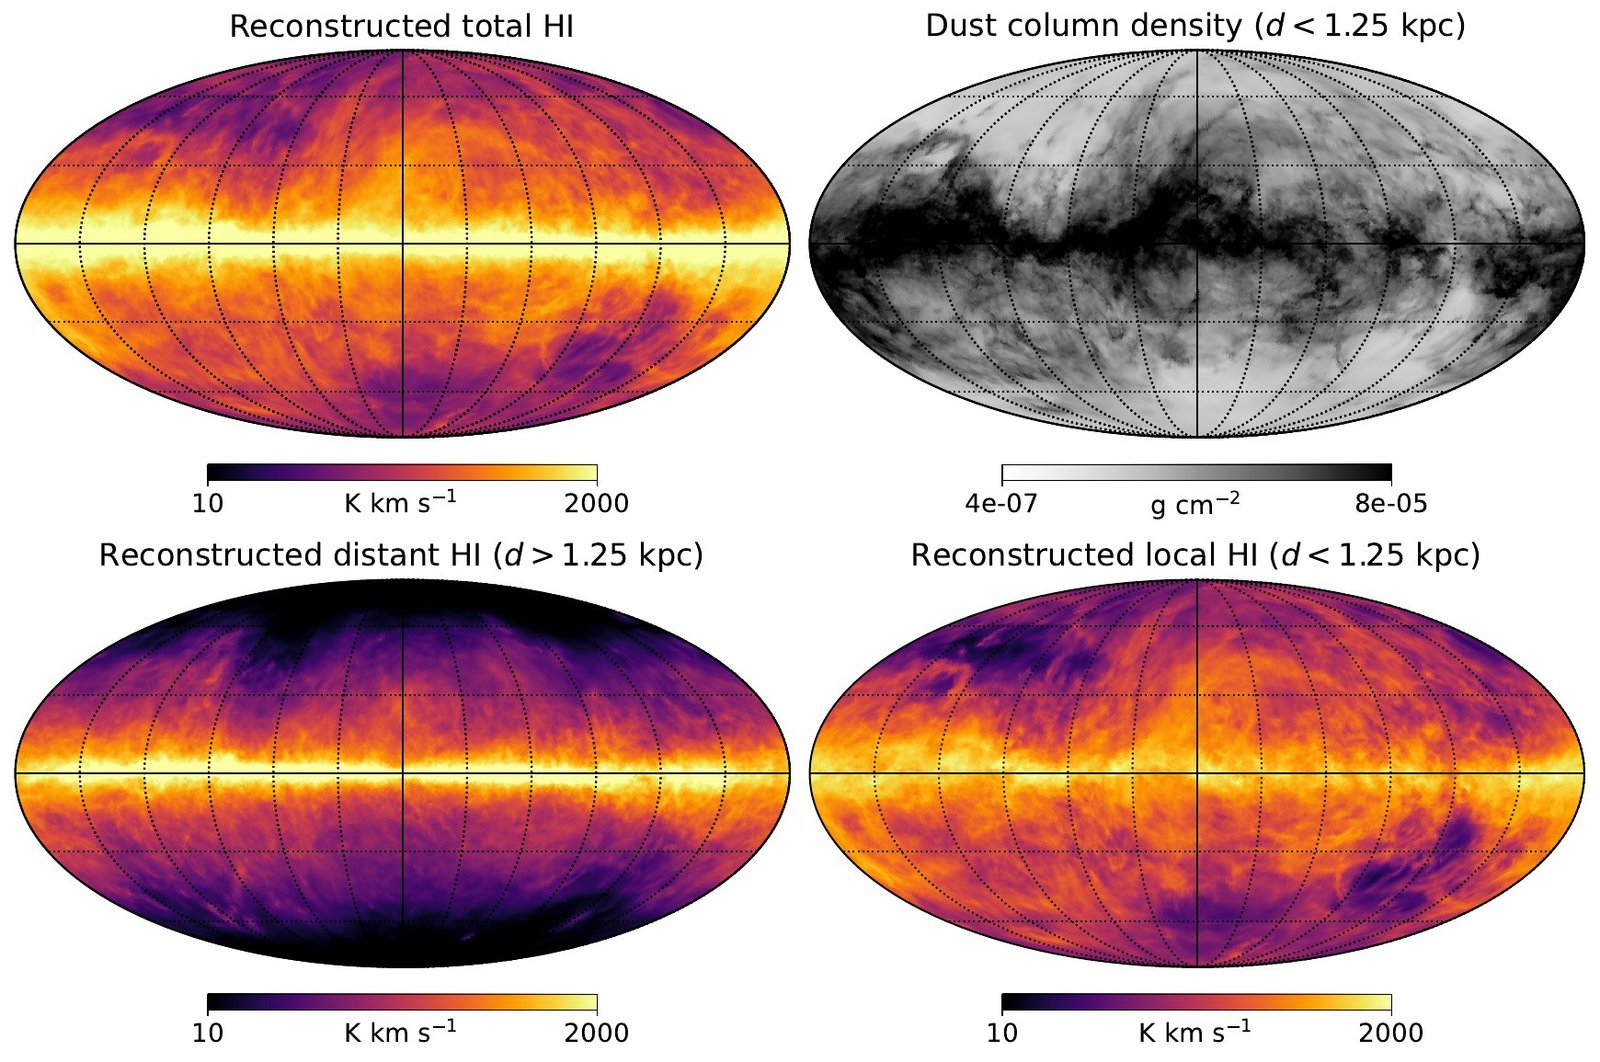
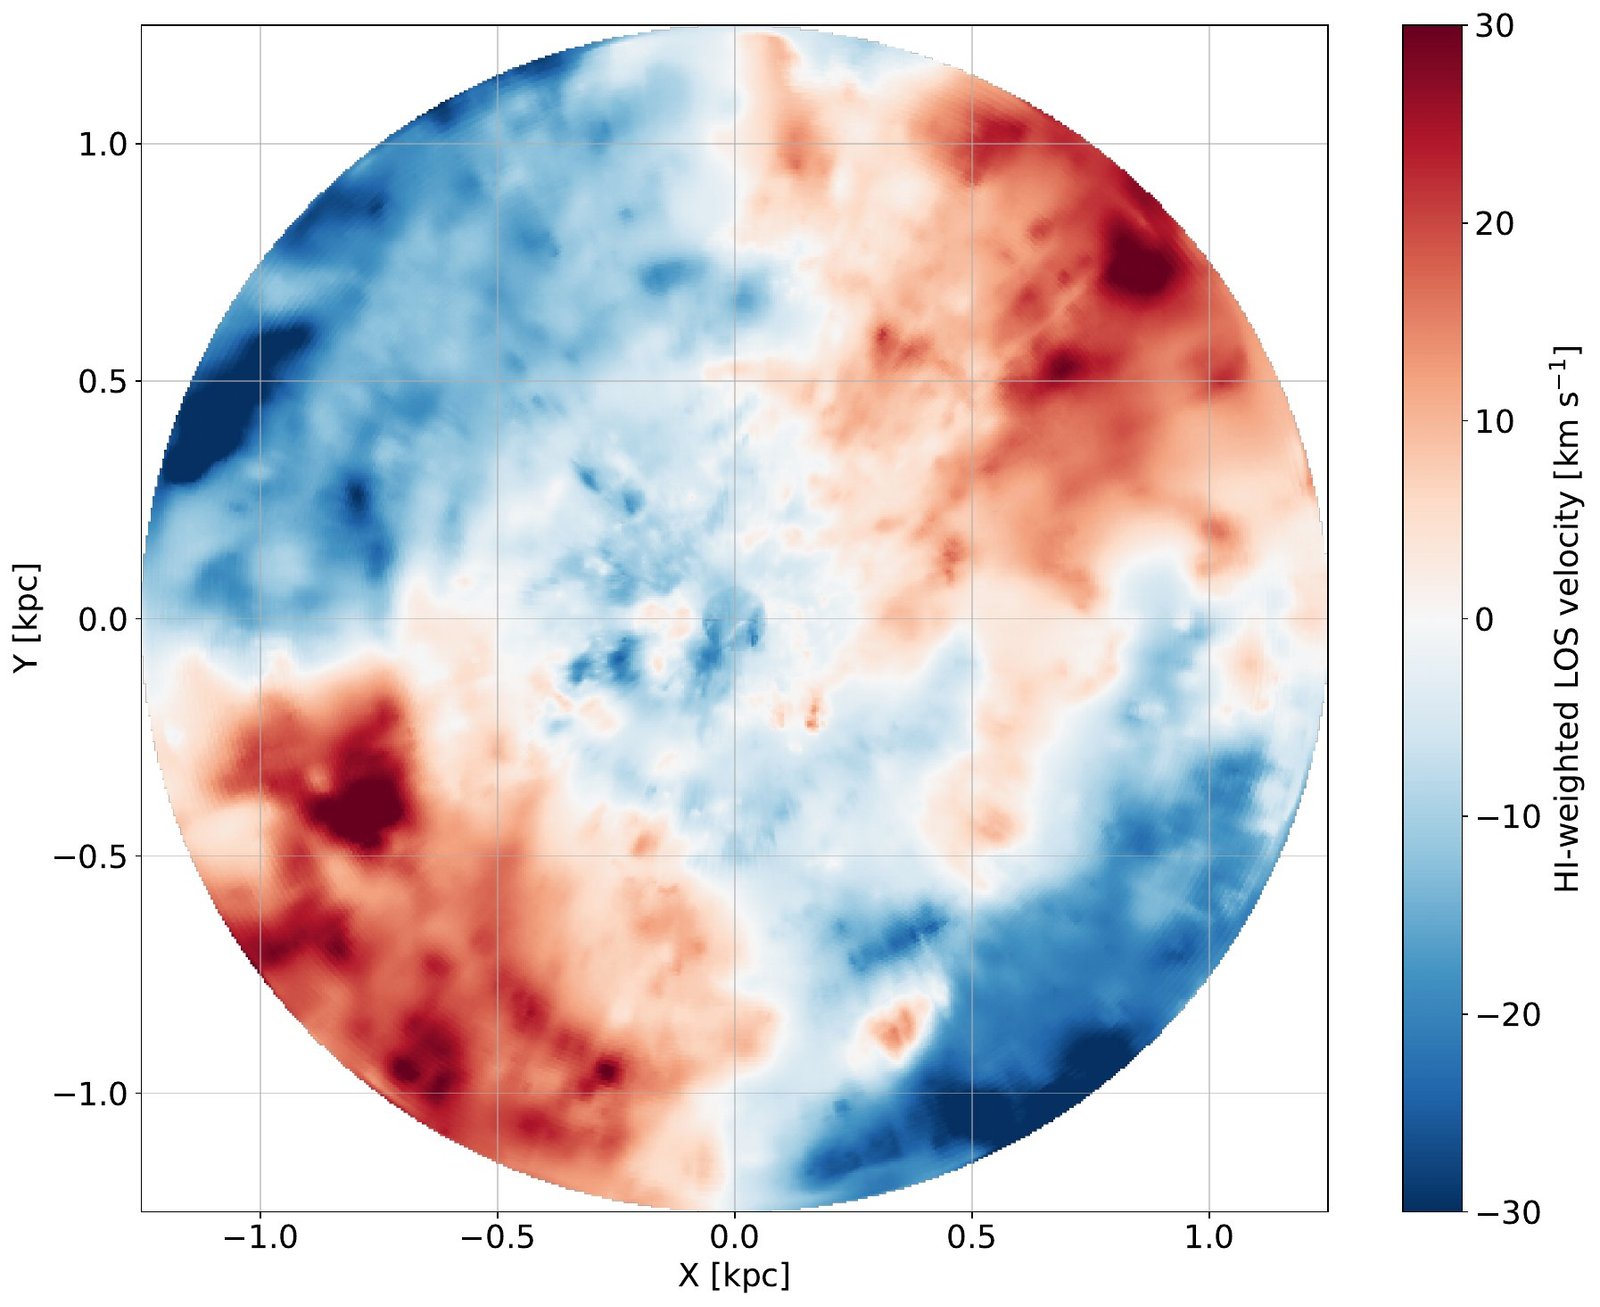
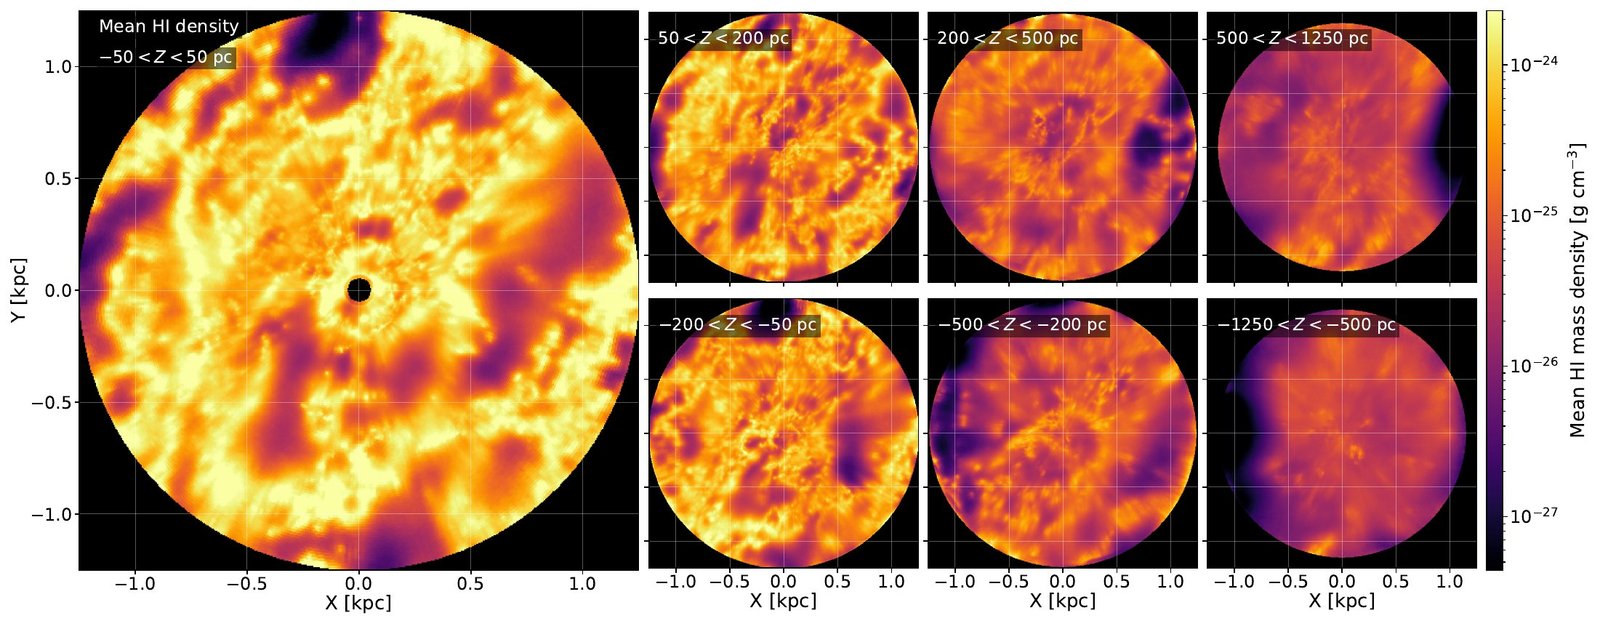
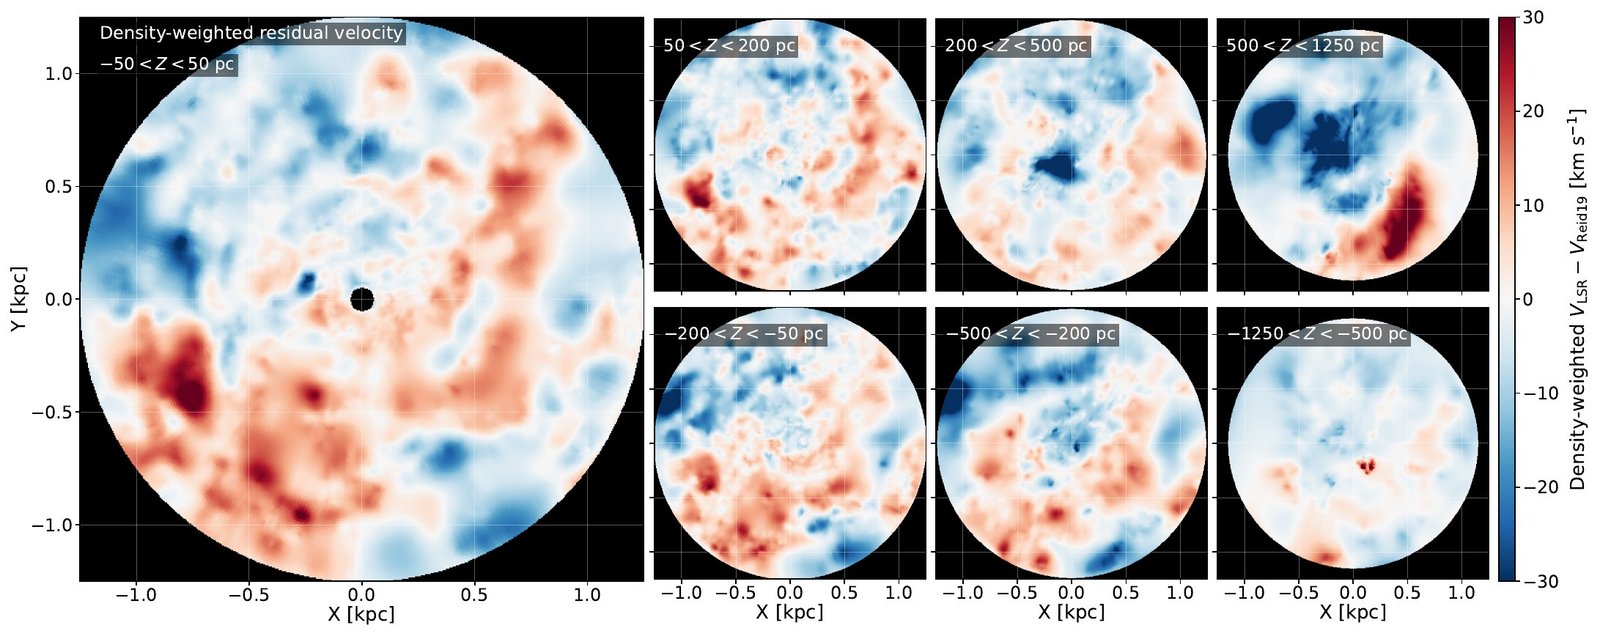
A velocity-resolved 3D map of atomic hydrogen within 1.25 kpc
McCallum et al. (2026), Monthly Notices of the Royal Astronomical Society
The 21-cm sky gives us velocity but not distance. This reconstruction separates nearby emission from distant Galactic structure and places the local atomic gas into a three-dimensional volume around the Sun.
2026
Galactic magnetic field
The radial component of the local Galactic magnetic field in 3D
McCallum et al. (2026), Monthly Notices of the Royal Astronomical Society
This reconstruction combines my electron-density map with the Hutschenreuter et al. Faraday-rotation sky to infer how the line-of-sight magnetic field runs through the local volume. The animation follows samples from the posterior, showing both the recovered structure and where the reconstruction remains uncertain.
2025
Multiwavelength ionized gas
A 3D, multiwavelength view of the Milky Way's local ionized gas
McCallum, Wood, Benjamin, Krishnarao & Vandenbroucke (2025), MNRAS
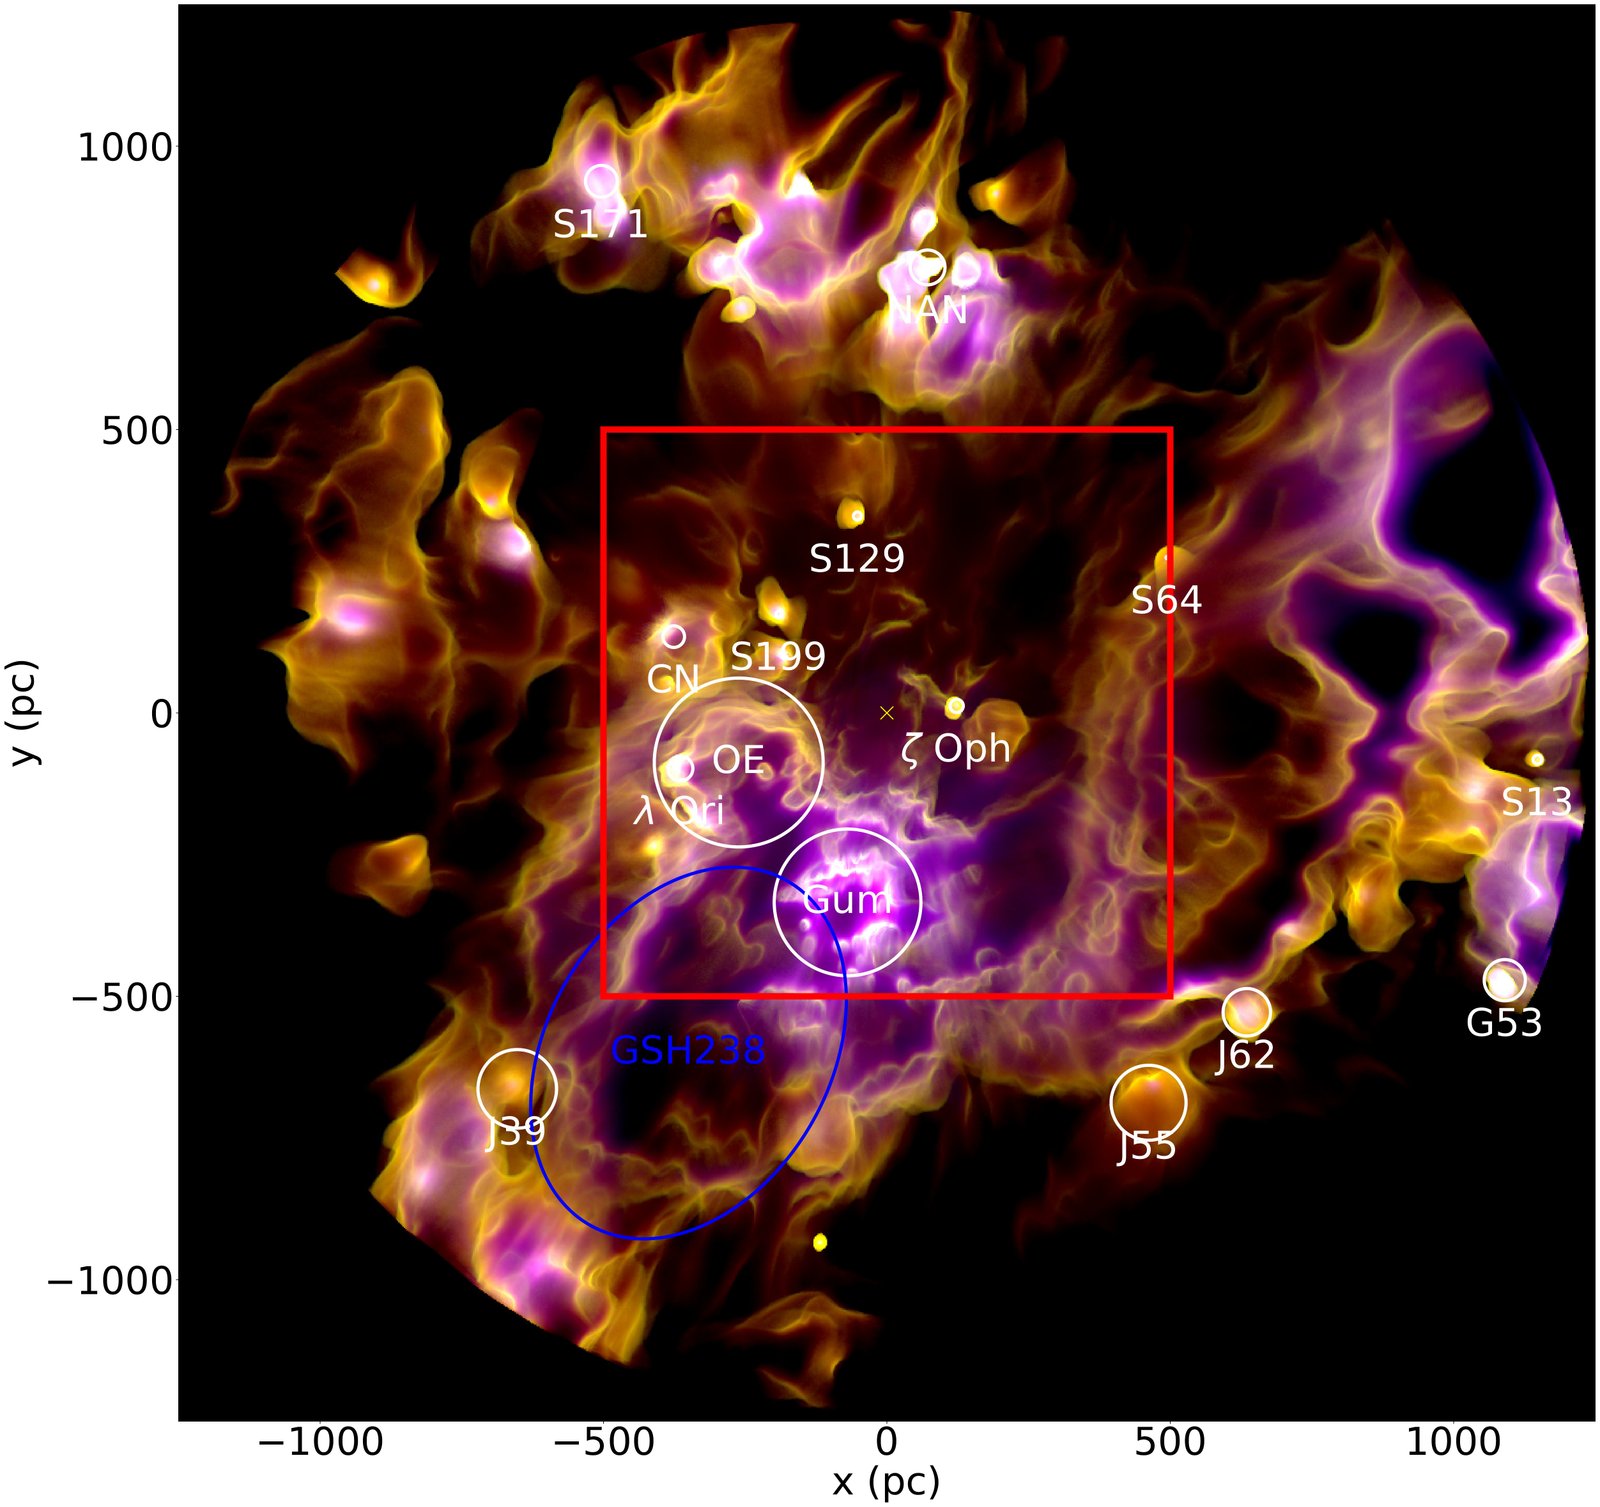
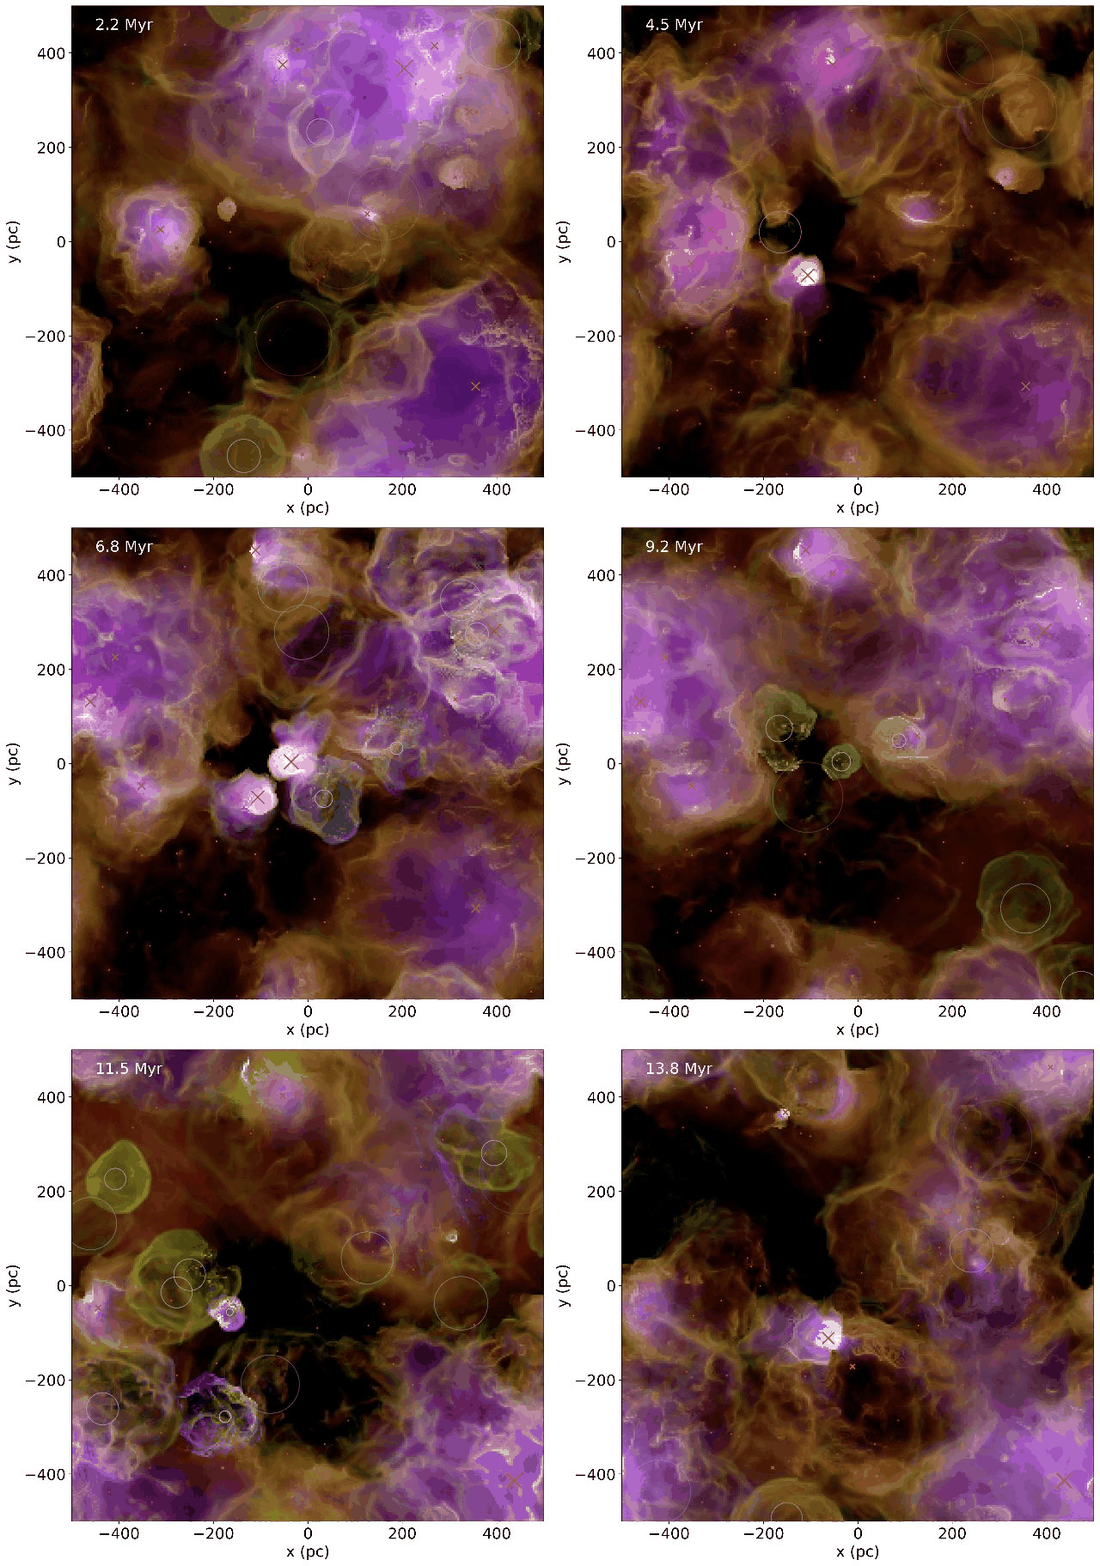
Using the Edenhofer 3D dust map and a census of nearby O stars, this simulation follows ionizing photons through the local ISM and predicts Hα, [S II], and [O III] emission. The lines respond differently to temperature and ionization, making it easier to compare where massive stars ionize gas and where recent supernova shocks affect the emission.
Stellar environment
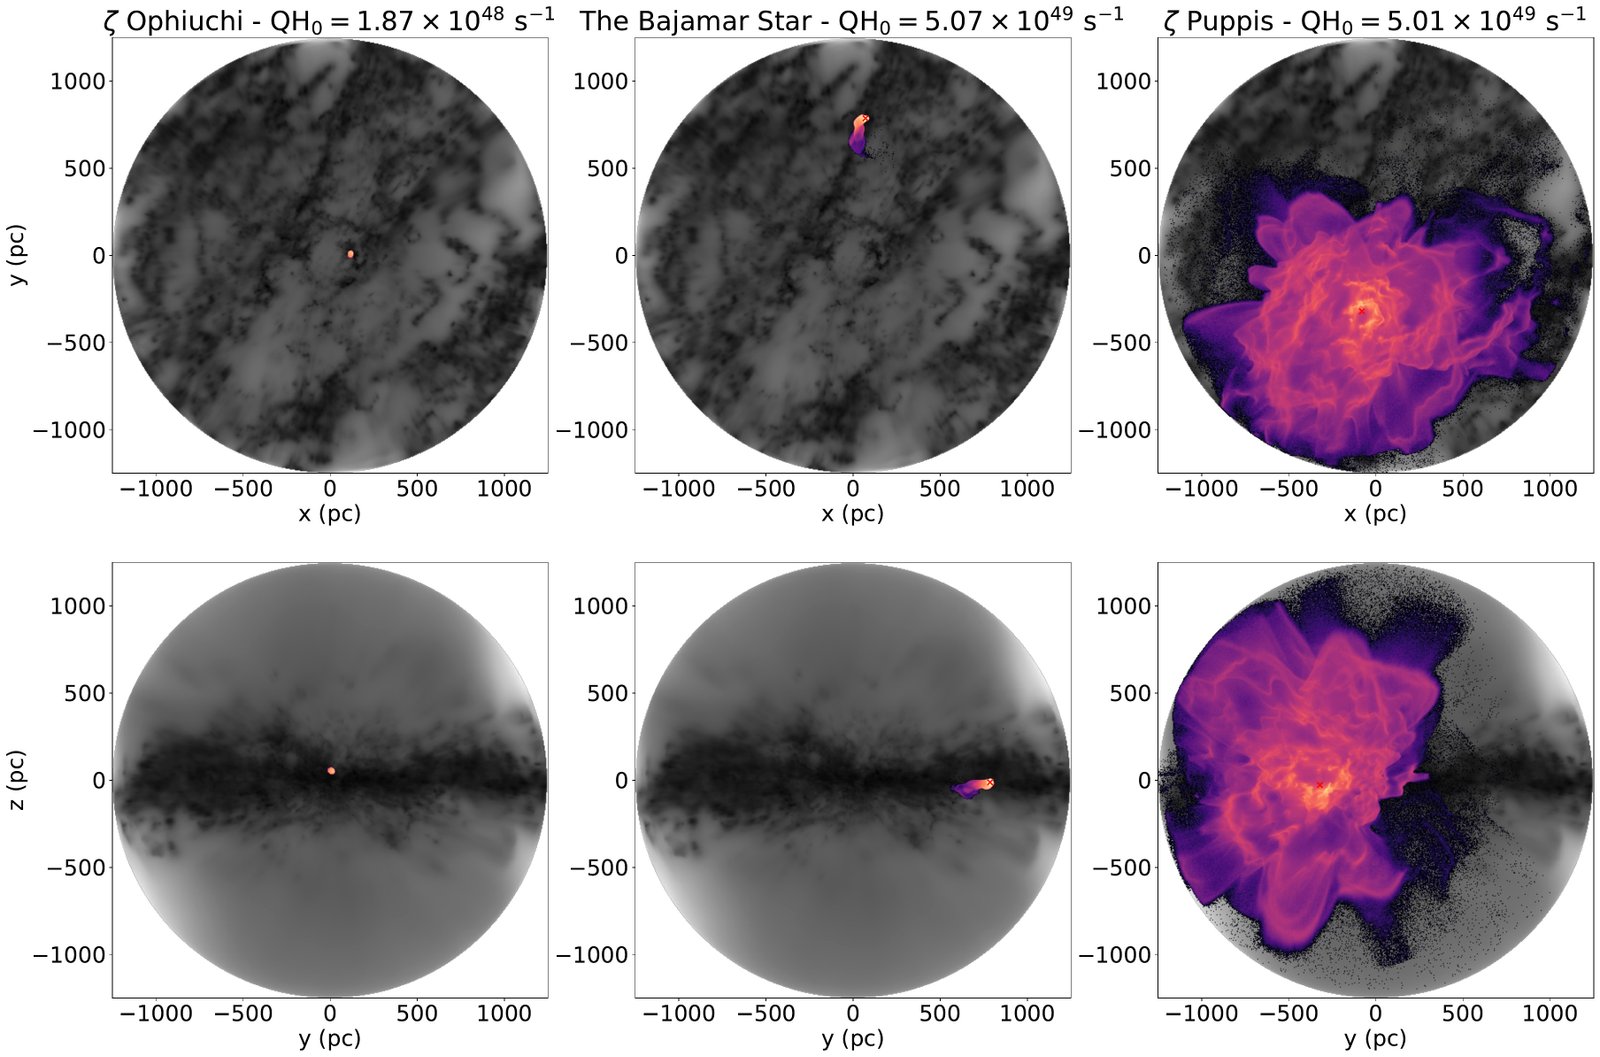
The surrounding gas changes how far a star's photons travel
Ionizing luminosity is not the only factor. ζ Puppis and the Bajamar star emit nearly the same number of ionizing photons, but their environments give them very different reach. In this model, ζ Puppis influences a volume 827 times larger, showing how strongly a star's environment controls its impact on the wider ISM.
The same paper, followed through time
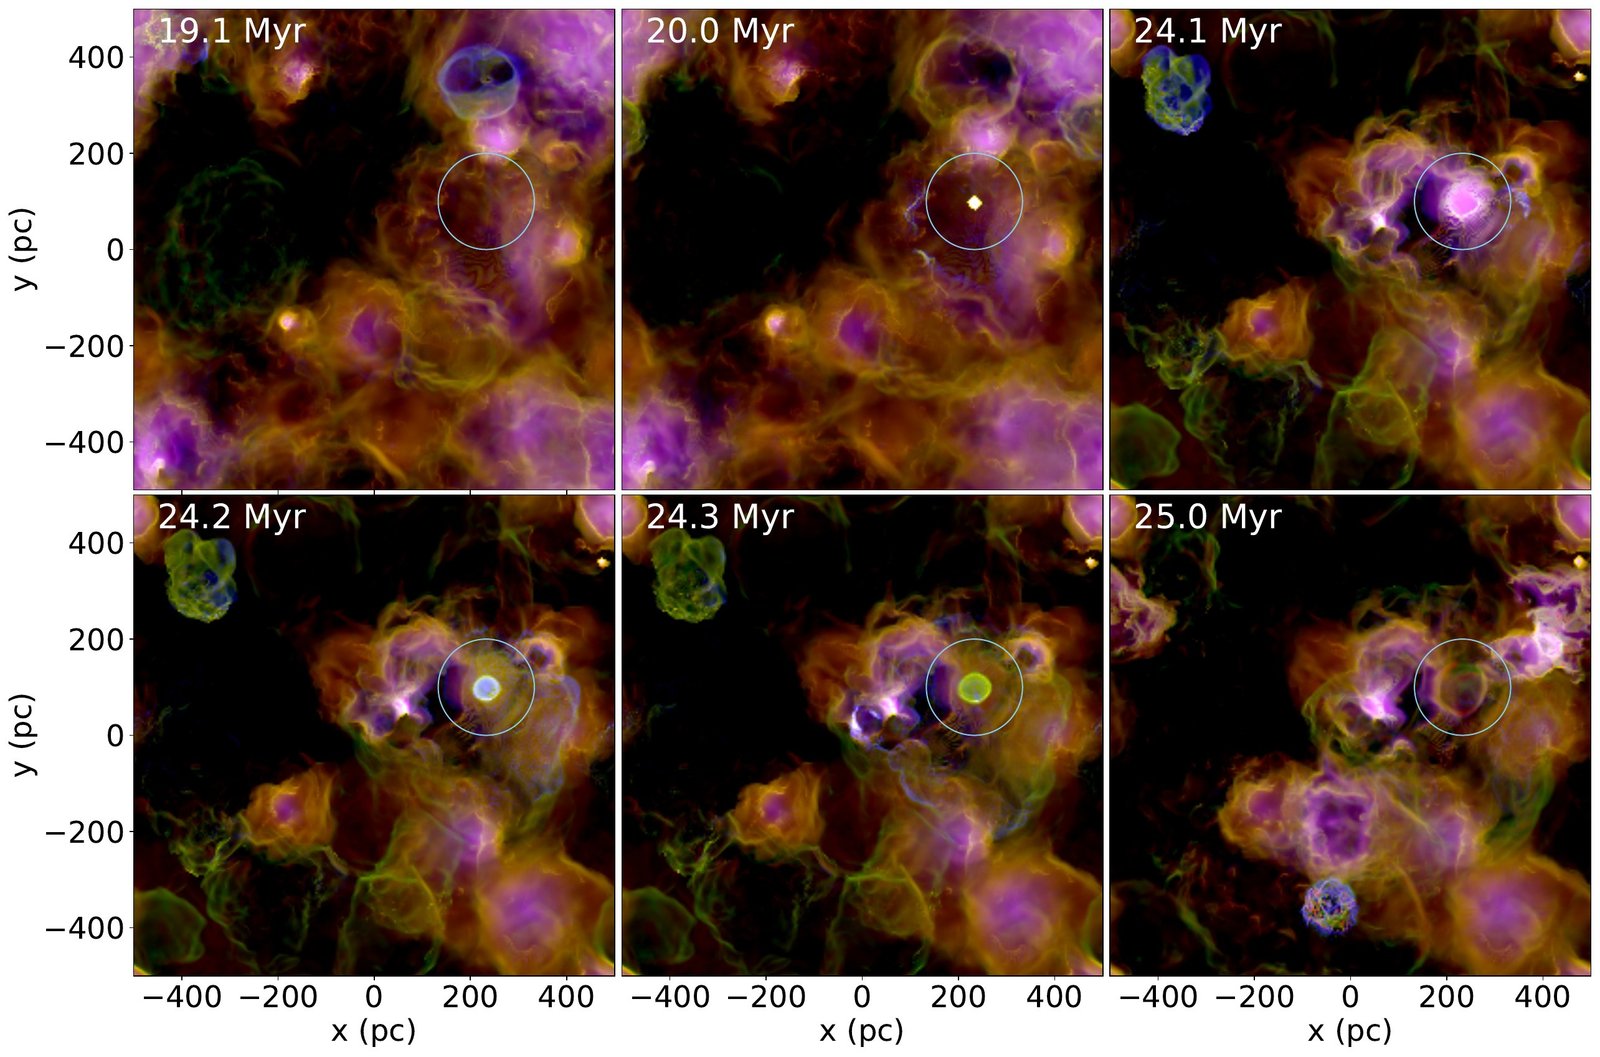
Birth cloud, H II region, supernova, remnant
A typical massive star first lights and disperses its birth cloud. Its supernova then flashes as an [O III]-bright shell, cools into [S II], and finally folds back into the turbulent interstellar medium.
2025
The local Hα sky
The Hα sky in three dimensions
McCallum et al. (2025), Monthly Notices of the Royal Astronomical Society: Letters
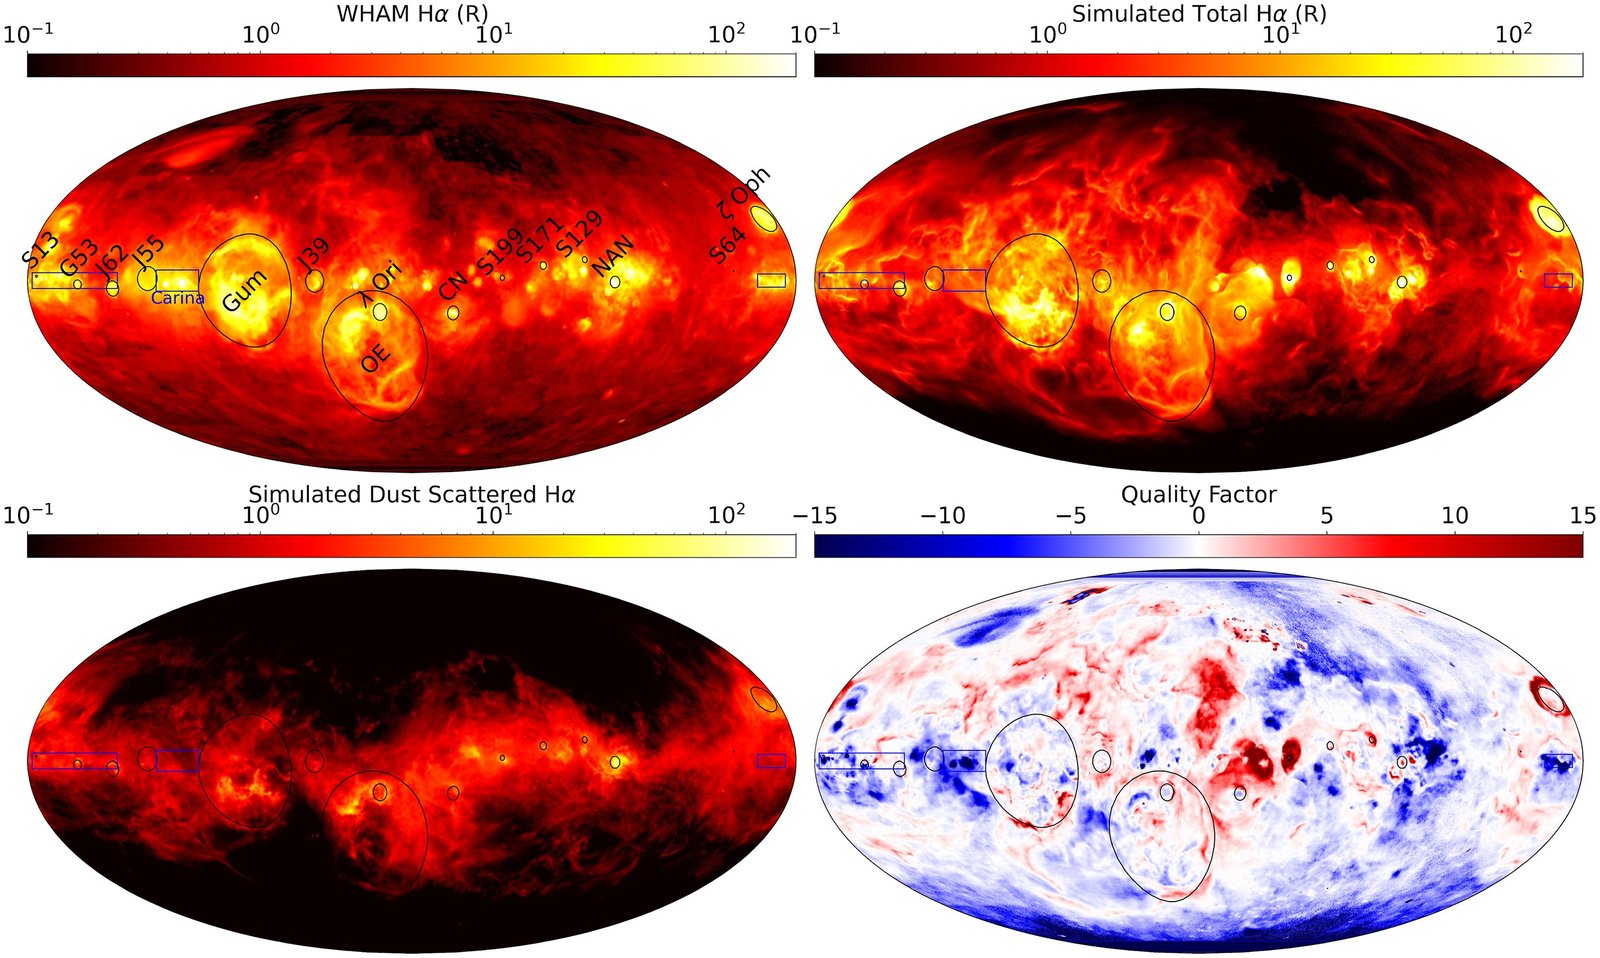
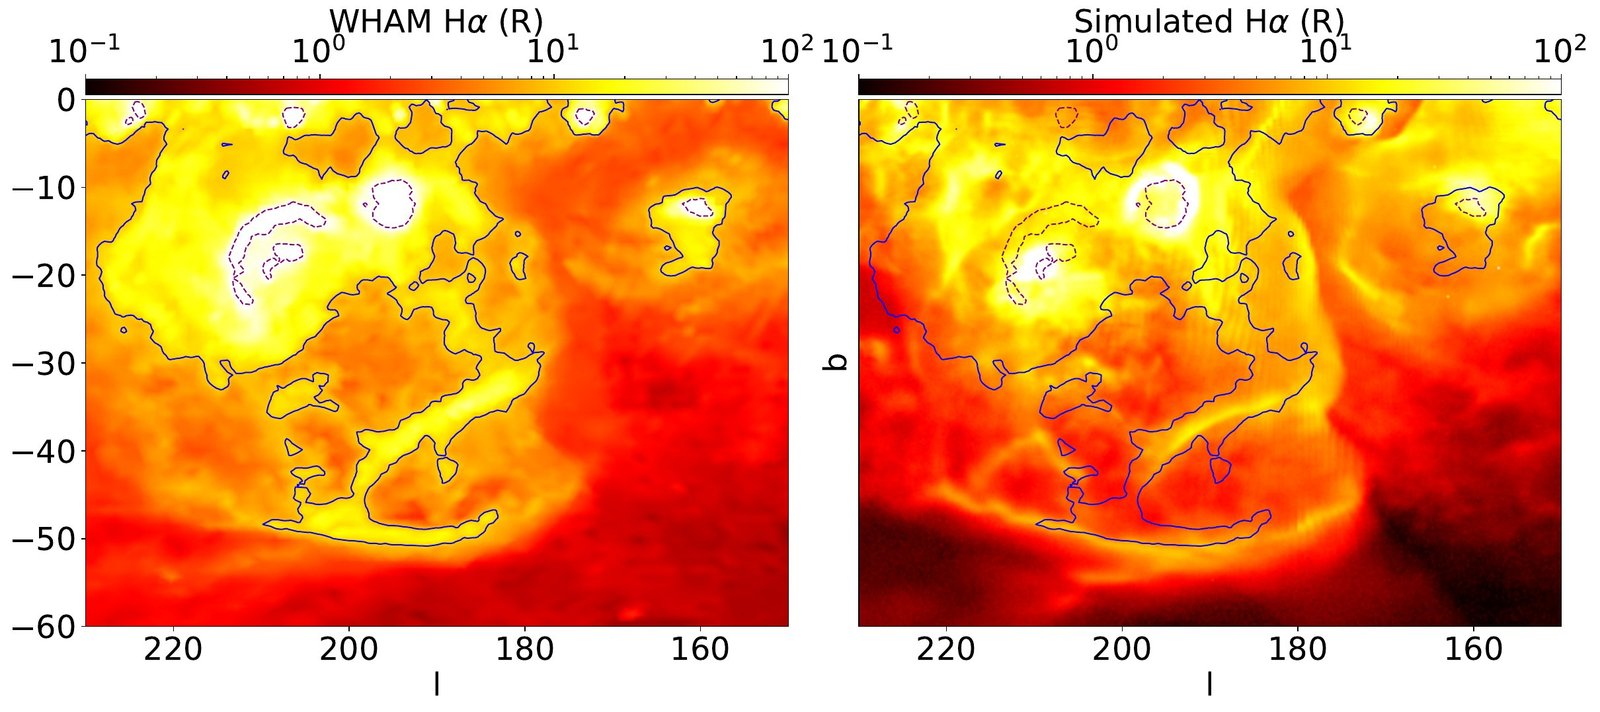
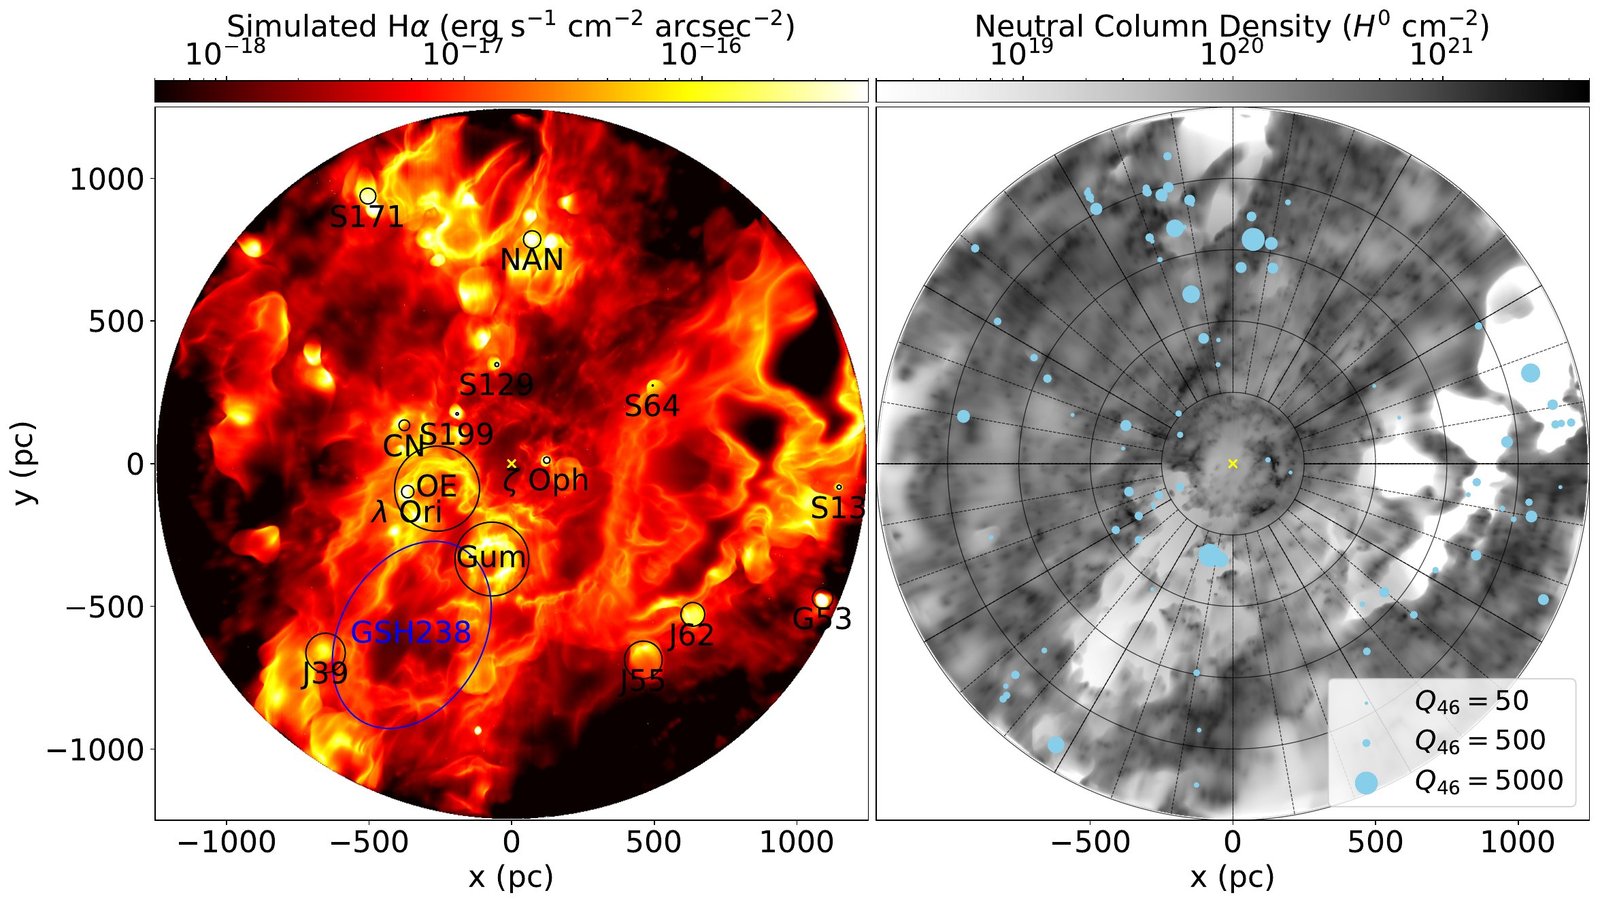
Starting from a 3D dust map and the nearby O-star population, the model predicts the Hα sky from the Sun. Comparing the result with WHAM provides a check on how well the mapped gas and nearby stars reproduce the observed emission.
2024
Time-dependent metal ionization
Persistent collisionally excited emission from diffuse ionized gas
McCallum, Wood, Benjamin, Krishnarao & Vandenbroucke (2024), MNRAS
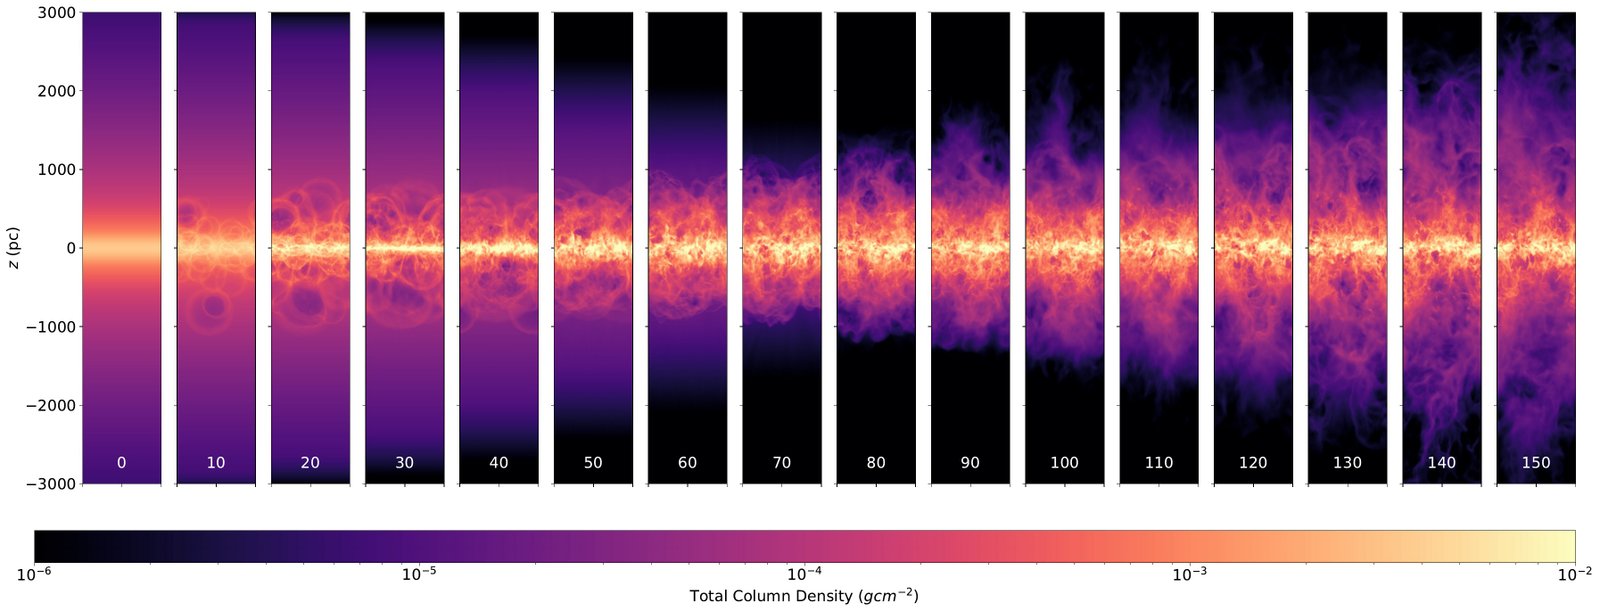
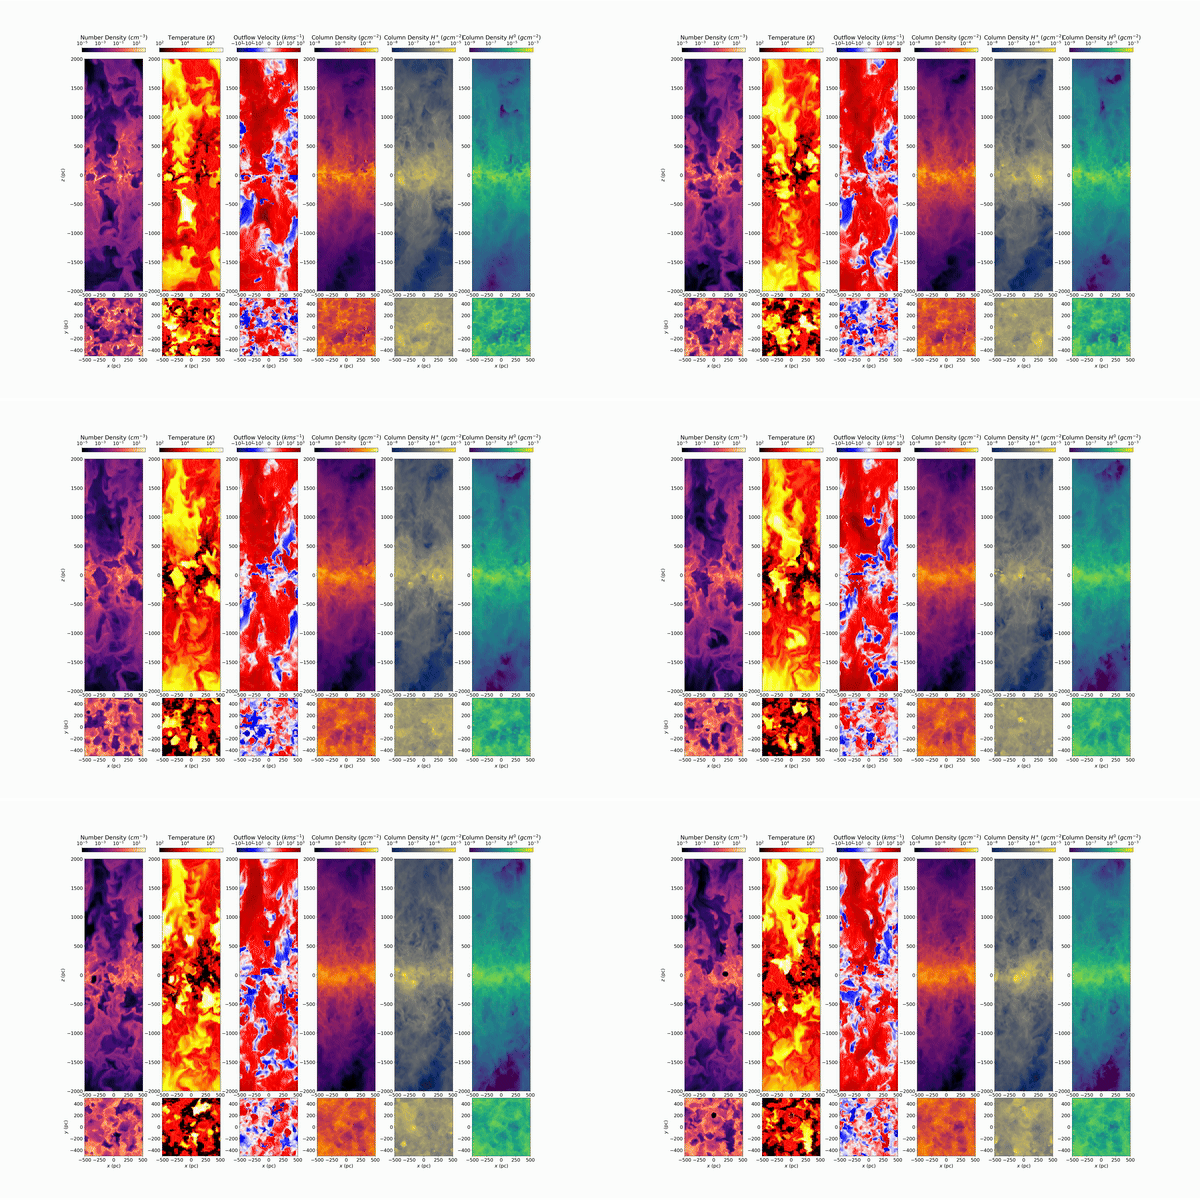
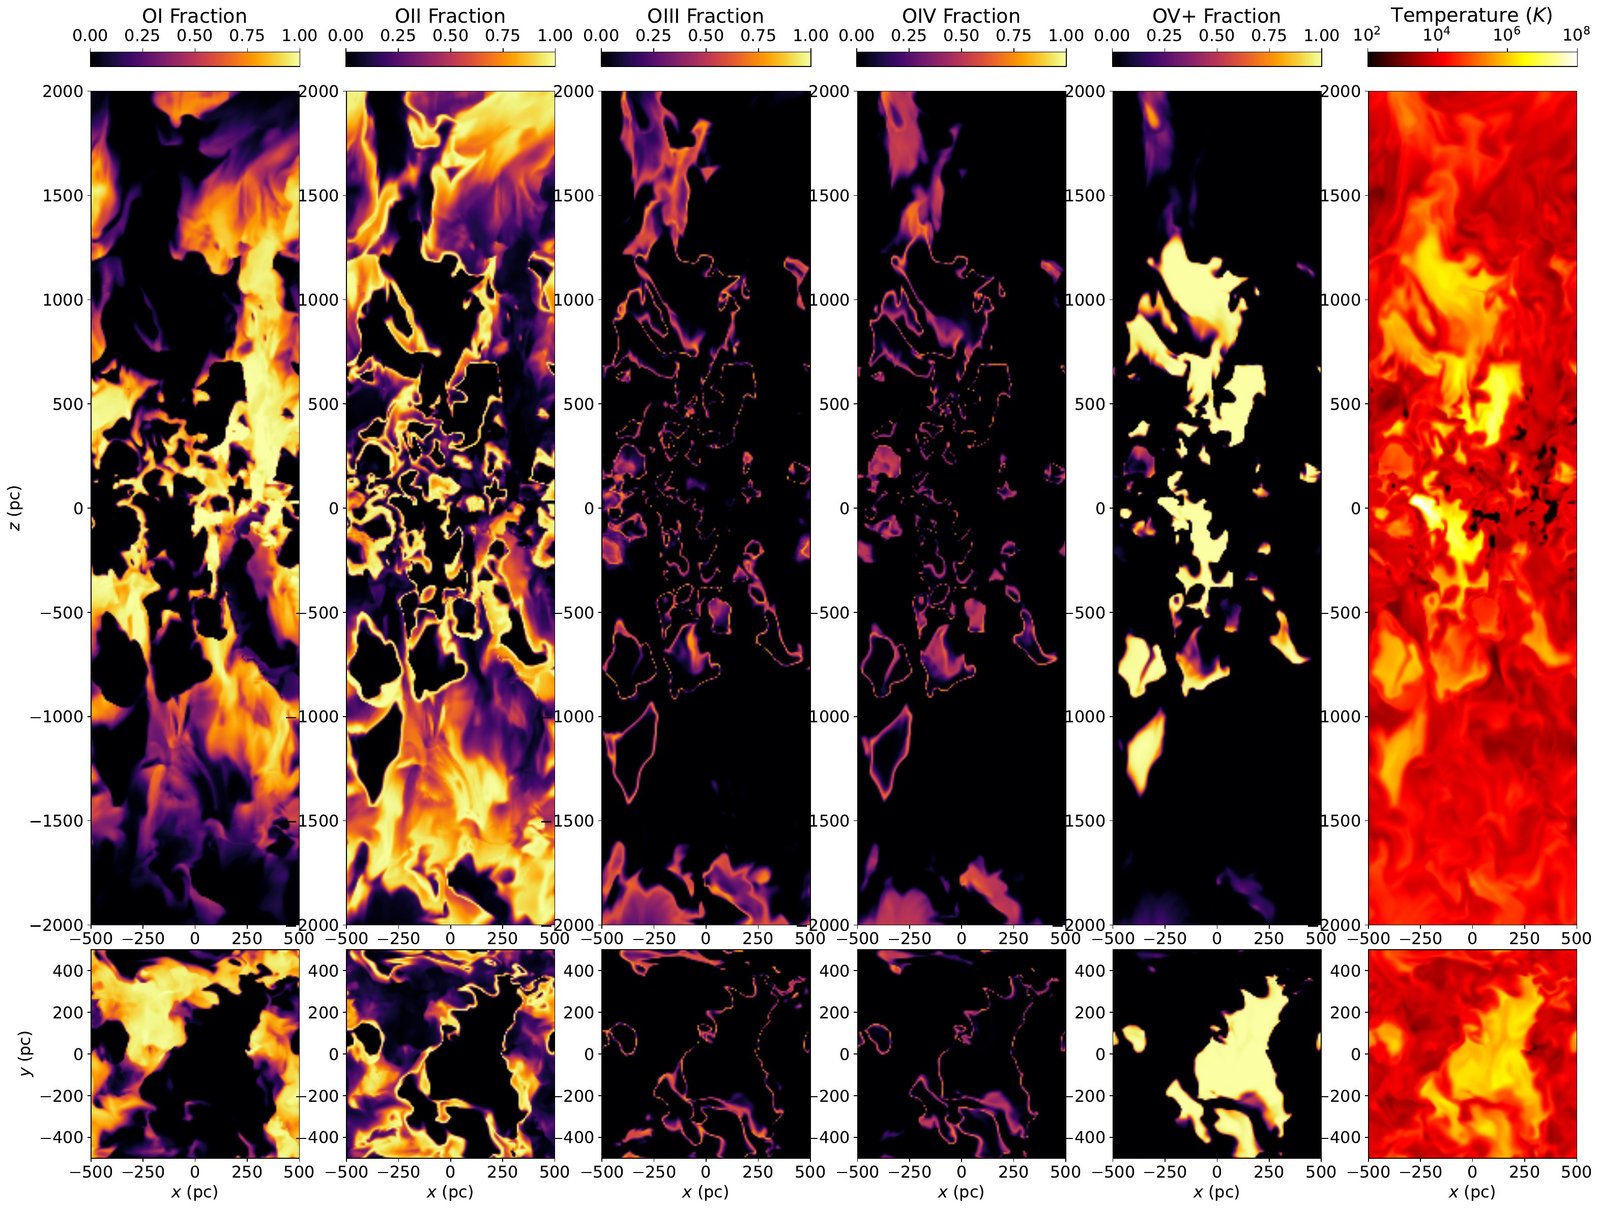
Oxygen does not move instantly between ionization states as the gas heats and cools. The result is an onion-skin structure around hot bubbles, with high ions surviving in thin gas long after a simple equilibrium model would erase them.
2024
High-altitude diffuse ionized gas
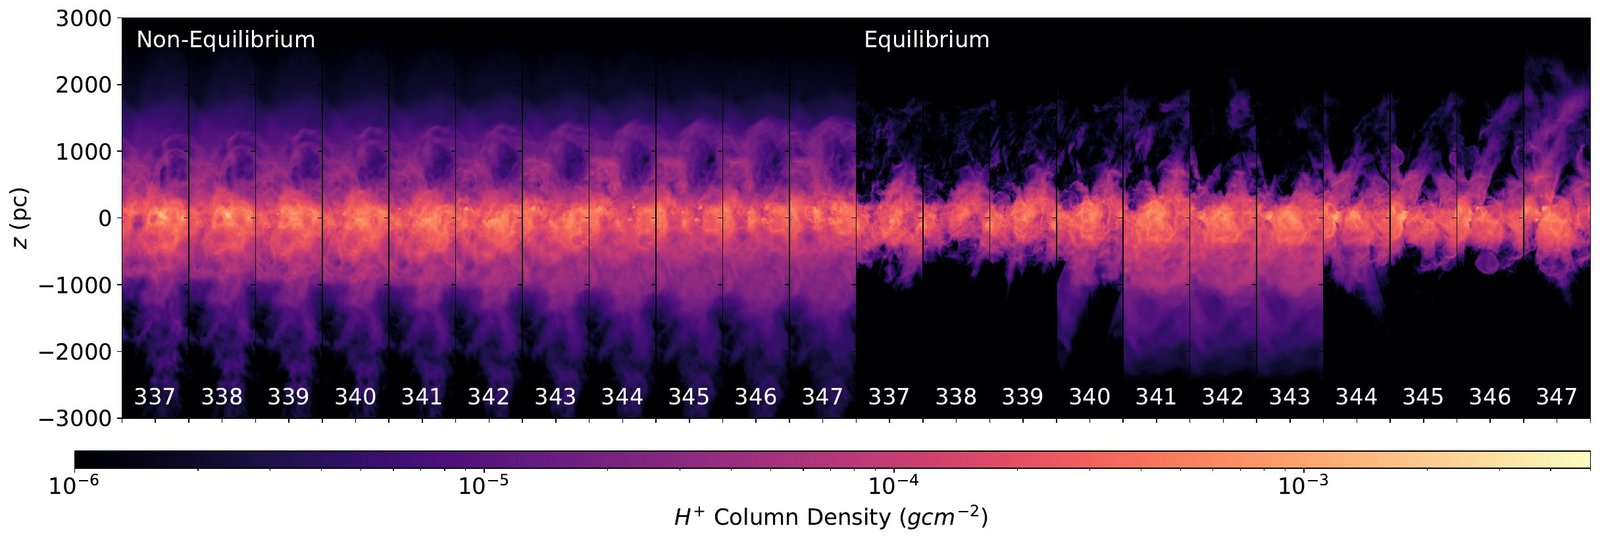
The persistence of high-altitude non-equilibrium ionized gas
McCallum et al. (2024), Monthly Notices of the Royal Astronomical Society
In low-density gas, recombination can take millions of years. Following that delay directly produces a stable, extended ionized layer; forcing the gas into equilibrium instead makes the layer flicker with the short lives of its stars.